
Leonardo Tizon
Sr Data Engineer
Is your company turning data into actionable business strategies?
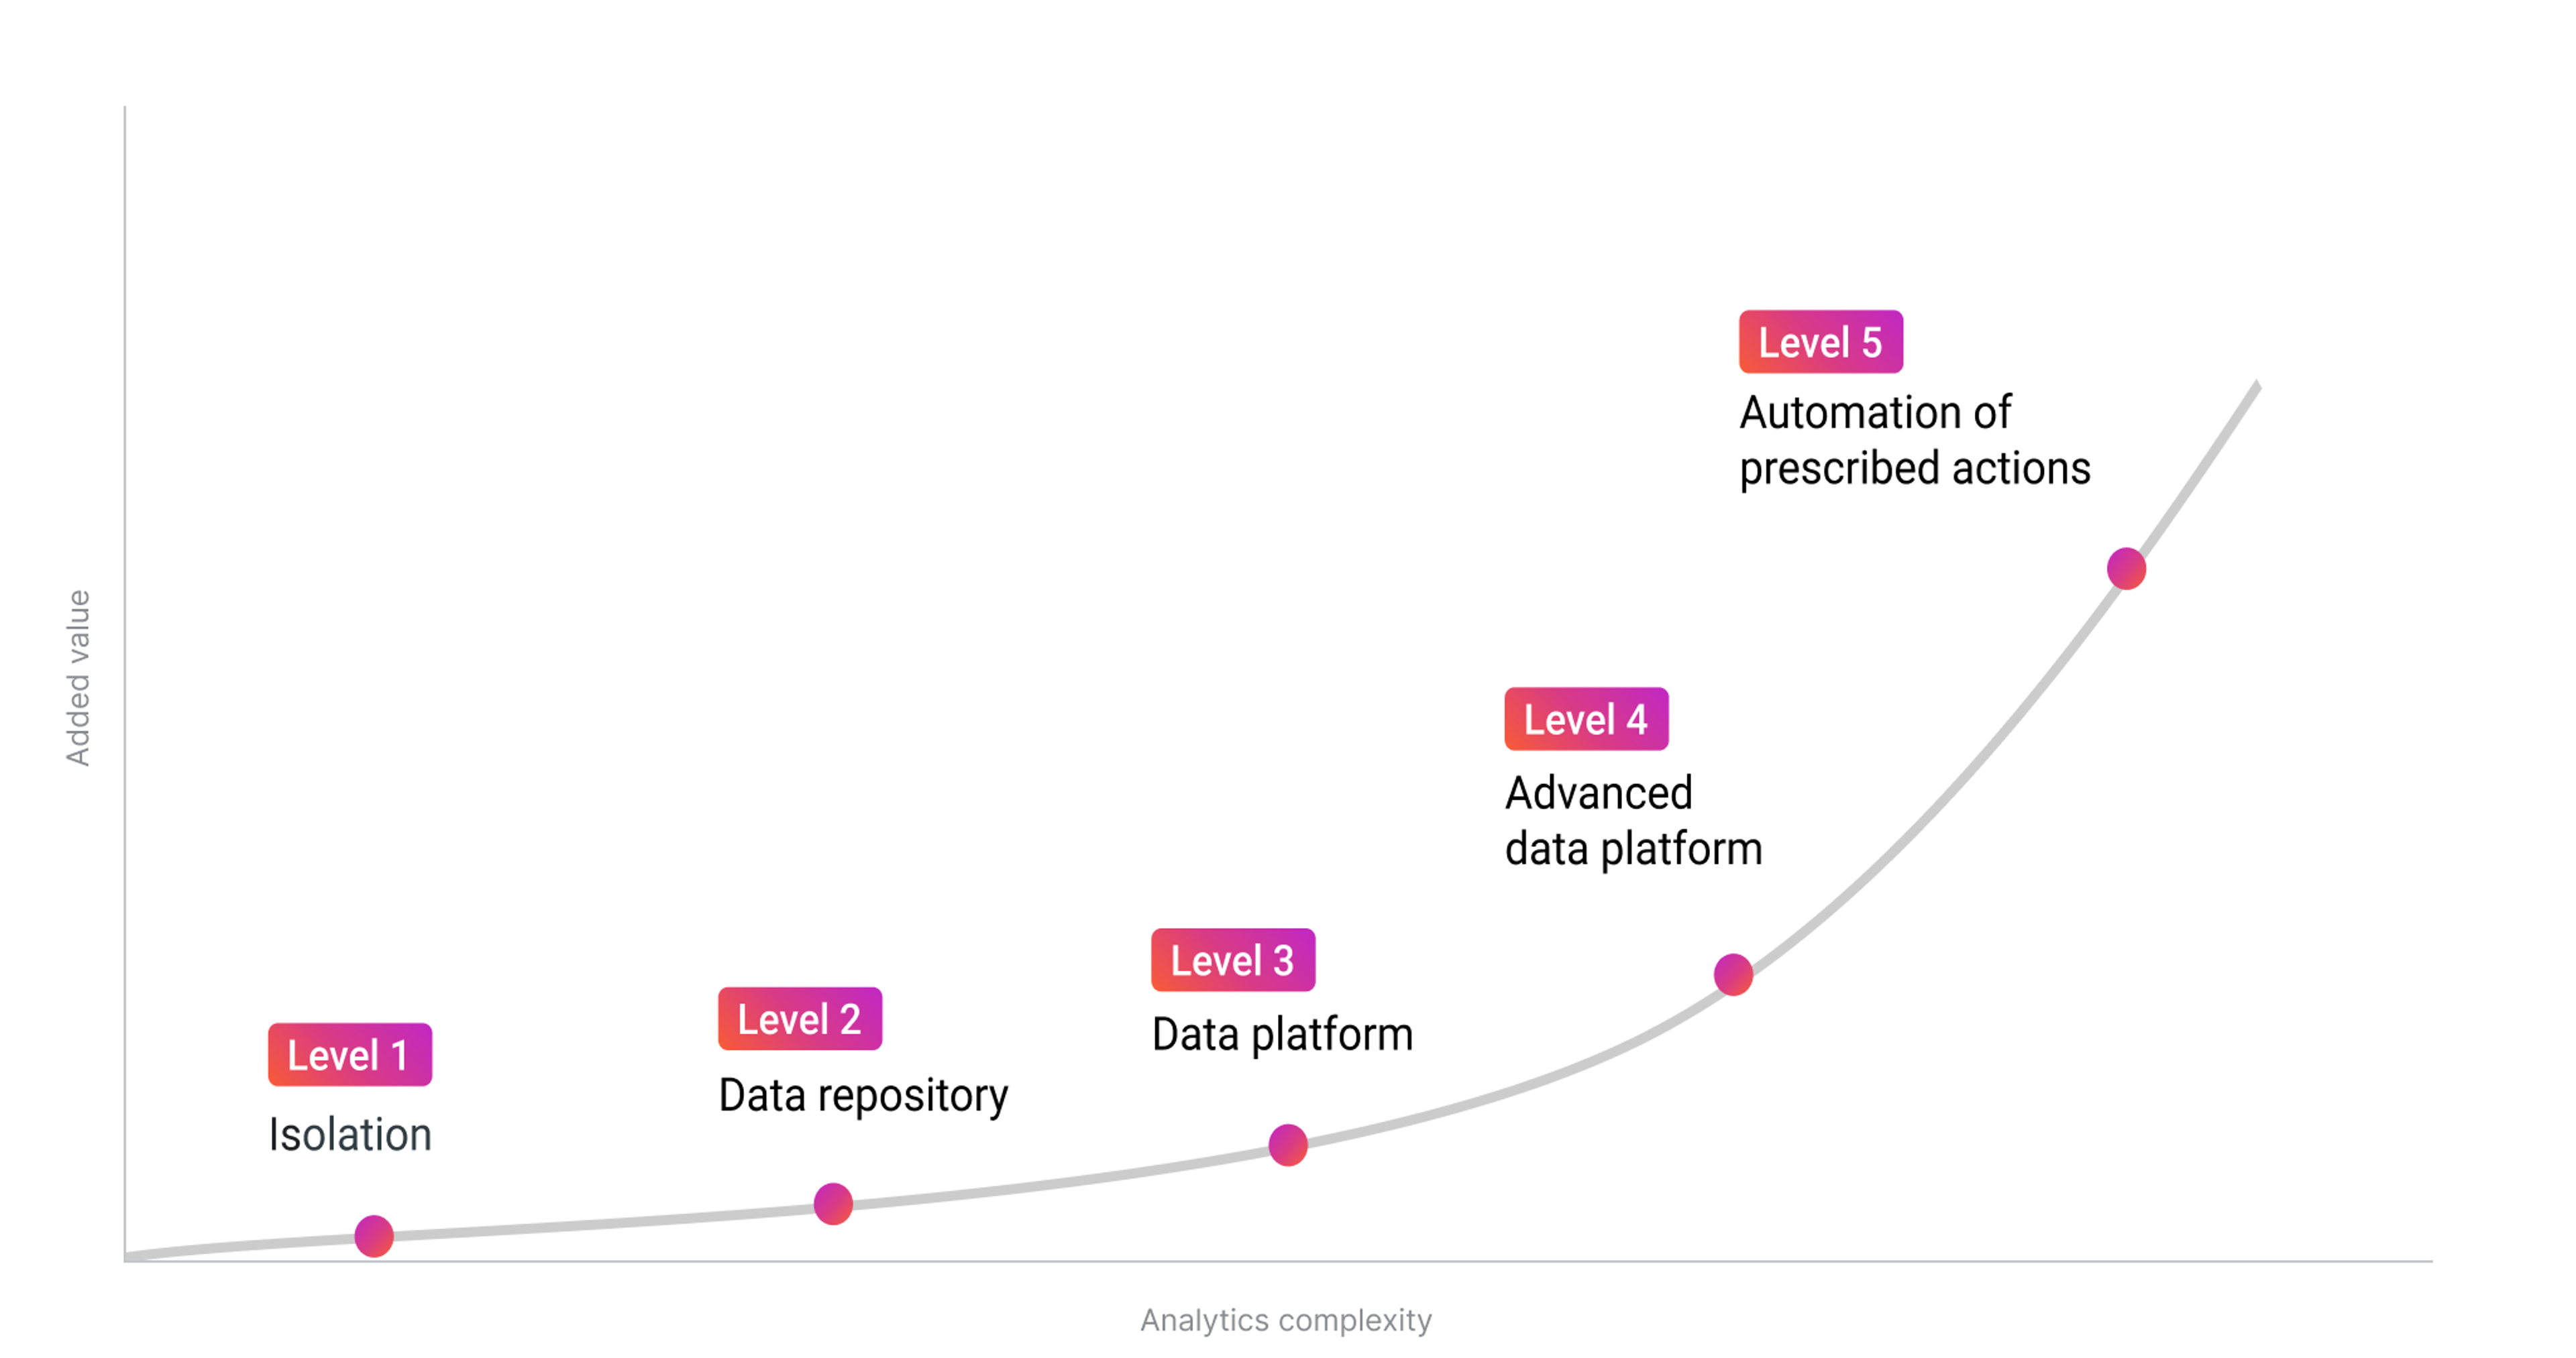
In order to make informed decisions that support business growth, understanding the maturity of your organization's data capabilities is crucial. Drawing from years of experience building technology partnerships with diverse companies, the Data & Analytics team at CloudX utilizes a comprehensive framework to assess the maturity of an organization's data capabilities. This framework, known as the “Data & Analytics Maturity Curve”, is something I put together, drawing inspiration from my extensive experience and various sources. It helps our clients identify where they currently stand and where they aspire to be in their data journey. The framework defines five maturity levels to assess a business' data ecosystem.

First, what do we mean by “maturity”?
Data maturity refers to the extent to which an organization effectively manages, utilizes, and leverages its data assets to drive business outcomes. It involves the processes, technologies, practices, and people that enable an organization to transform raw data into meaningful insights that can be turned into actionable steps.
The Data & Analytics Maturity Curve measures a company's data maturity level. Higher levels indicate more complex analytics practices and greater value derived from data resulting in greater returns on investment.
At CloudX, when we onboard a new client requiring Data & Analytics expertise, the first thing we do is assess their data infrastructure using this framework. We focus on evaluating capabilities such as:
After gathering this information, we can determine the maturity level of our client’s business, and plan accordingly to evolve their infrastructure to the next level.
At Level 1 of the Data & Analytics Maturity Curve, organizations operate in a state of isolation. This level is characterized by standalone analytics and data silos, where data is not integrated across the organization. Data extraction is often manual and lacks standardization, making it difficult to consume and analyze. There is no formal data modeling, and only advanced SQL users can perform queries. The type of analytics conducted at this stage is primarily descriptive, providing limited insights into past events without offering more advanced capabilities, such as predictive or prescriptive analytics.
In this isolated state, decision-making is hindered by fragmented data and inconsistent practices, if any at all. Organizations at this level struggle to leverage their data effectively, resulting in missed opportunities and inefficiencies. Moving beyond this stage requires establishing centralized data practices, integrating data sources, and adopting standardized processes to improve data accessibility and usability.
At Level 2, organizations transition from isolated data practices to standard approaches to managing and organizing data, depending on the organization’s needs. From data warehouse, through data lake, data lakehouse to data mesh, the highlight of this level is that data is collected and managed in a way that aligns with organizational requirements. This typically involves creating data repositories—either centralized or decentralized—where data is collected, stored, and managed in a standardized manner. This approach provides a comprehensive view of the organization’s data and establishes well-defined data integration practices and governance. Raw data is processed and transformed into consumable formats, making it accessible for Business Intelligence (BI) analysts.
At this stage, analytics is both descriptive and diagnostic, which allows users to identify relationships between variables and uncover patterns. Root Cause Analysis (RCA) supports the business by shedding light on past events and their reasons. Data in managed repositories ensures reliable and governed analytics, providing a single source of truth for decision-making while addressing data quality and security concerns.
This level marks a significant improvement in data quality and security, as well as increased user adoption, which in turn enables businesses to execute well-informed strategic actions.
Level 3 represents an advancement towards a more sophisticated data platform. This level is marked by the implementation of an enhanced data platform, often utilizing a design pattern like medallion architecture and disciplines like DataOps. At this level, organizations adopt DataOps practices, which improve collaboration and communication, data quality, automation, scalability, and flexibility. As a result, they enhance the efficiency and reliability of data analytics processes. They also begin moving from descriptive analytics to predictive analytics, enabling more advanced capabilities.
BI users and Data Scientists benefit from self-service capabilities, allowing them to access and analyze data independently. Analytics at this stage is primarily predictive, forecasting future trends and potential outcomes. This helps the business anticipate changing scenarios, such as opportunities or risks. Businesses at Level 3 foster a data-driven culture, where they leverage their data to make strategic decisions and optimize processes.
Organizations at Level 4 achieve an advanced data platform that significantly enhances their analytics capabilities. In this stage, data is shared both internally and externally, fostering a collaborative approach to data utilization. The organization maintains a single source of truth for AI, ML, and Generative AI models, ensuring consistency and reliability in data-driven insights. Advanced data modeling techniques are employed to generate actionable recommendations, and the data platform integrates seamlessly with Generative AI models.
Mature DataOps practices ensure efficient and effective data management. This level democratizes analytics capabilities, making them accessible to all users within the organization. Analytics is prescriptive, providing recommendations for actions based on predictive models. This is achieved through an advanced data platform that supports real-time data processing, allowing for immediate responses to changing conditions and emerging trends. Businesses at this level ensure that decision-makers are guided toward the best possible outcomes.
Level 5 of the Data & Analytics Maturity Curve is the highest level of data maturity, where businesses achieve the automation of prescribed actions. Companies that reach this level can make real-time decisions based on predictive and prescriptive analytics. They leverage advanced data architectures and technologies to ensure that data-driven insights are not only generated but also acted upon autonomously.
Continuous learning is a key feature at this stage, allowing the organization to adapt and improve its models and processes over time. The system can optimize and refine its actions based on real-time data and evolving conditions, which increases operational efficiency. This level represents a significant improvement in operational performance and business outcomes for the companies that reach it.
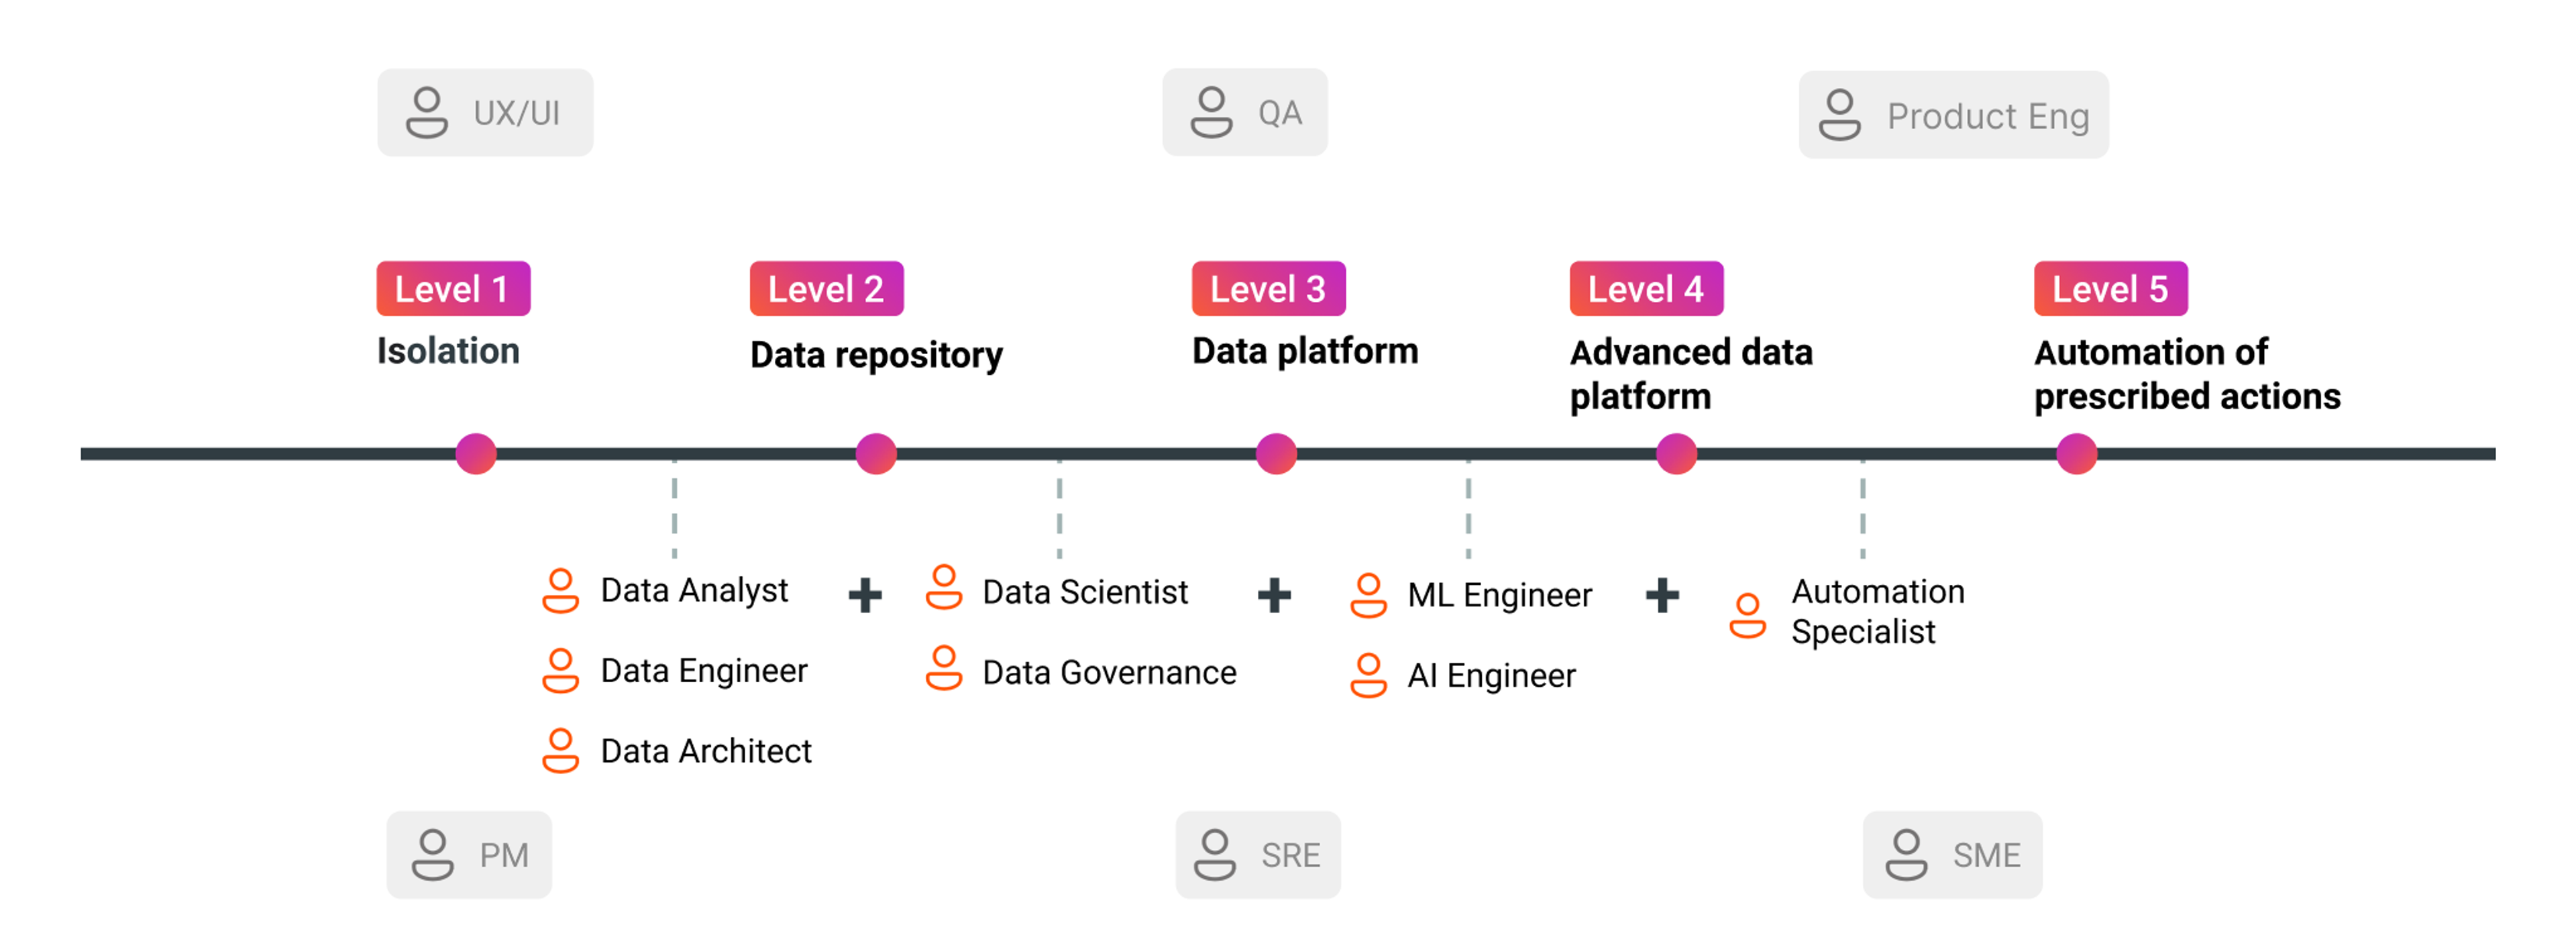
To assess your data maturity and achieve a higher level, it is essential to understand the roles involved and the supporting functions that can aid in this journey. Core roles such as Data Analysts, Data Engineers, and Data Architects are crucial at the initial stages, focusing on data extraction, transformation, and storage. As you progress, Data Scientists and Data Governance roles become vital for ensuring data quality and compliance. At more advanced levels, ML Engineers and AI Engineers develop predictive models and integrate advanced analytics. Automation Specialists play a key role in automating prescribed actions.
Supporting functions like UX/UI Design, QA, Platform Engineering, Product Engineering, Project Management (PM), Site Reliability Engineering (SRE), and Subject Matter Experts (SME) can be onboarded as needed. They complement the team with the necessary expertise to ensure a seamless and efficient data transformation process. Partnering with Data & Analytics experts who can provide tailored solutions and guide you through these stages will help you implement best practices, adopt advanced technologies, and transform your data capabilities effectively.

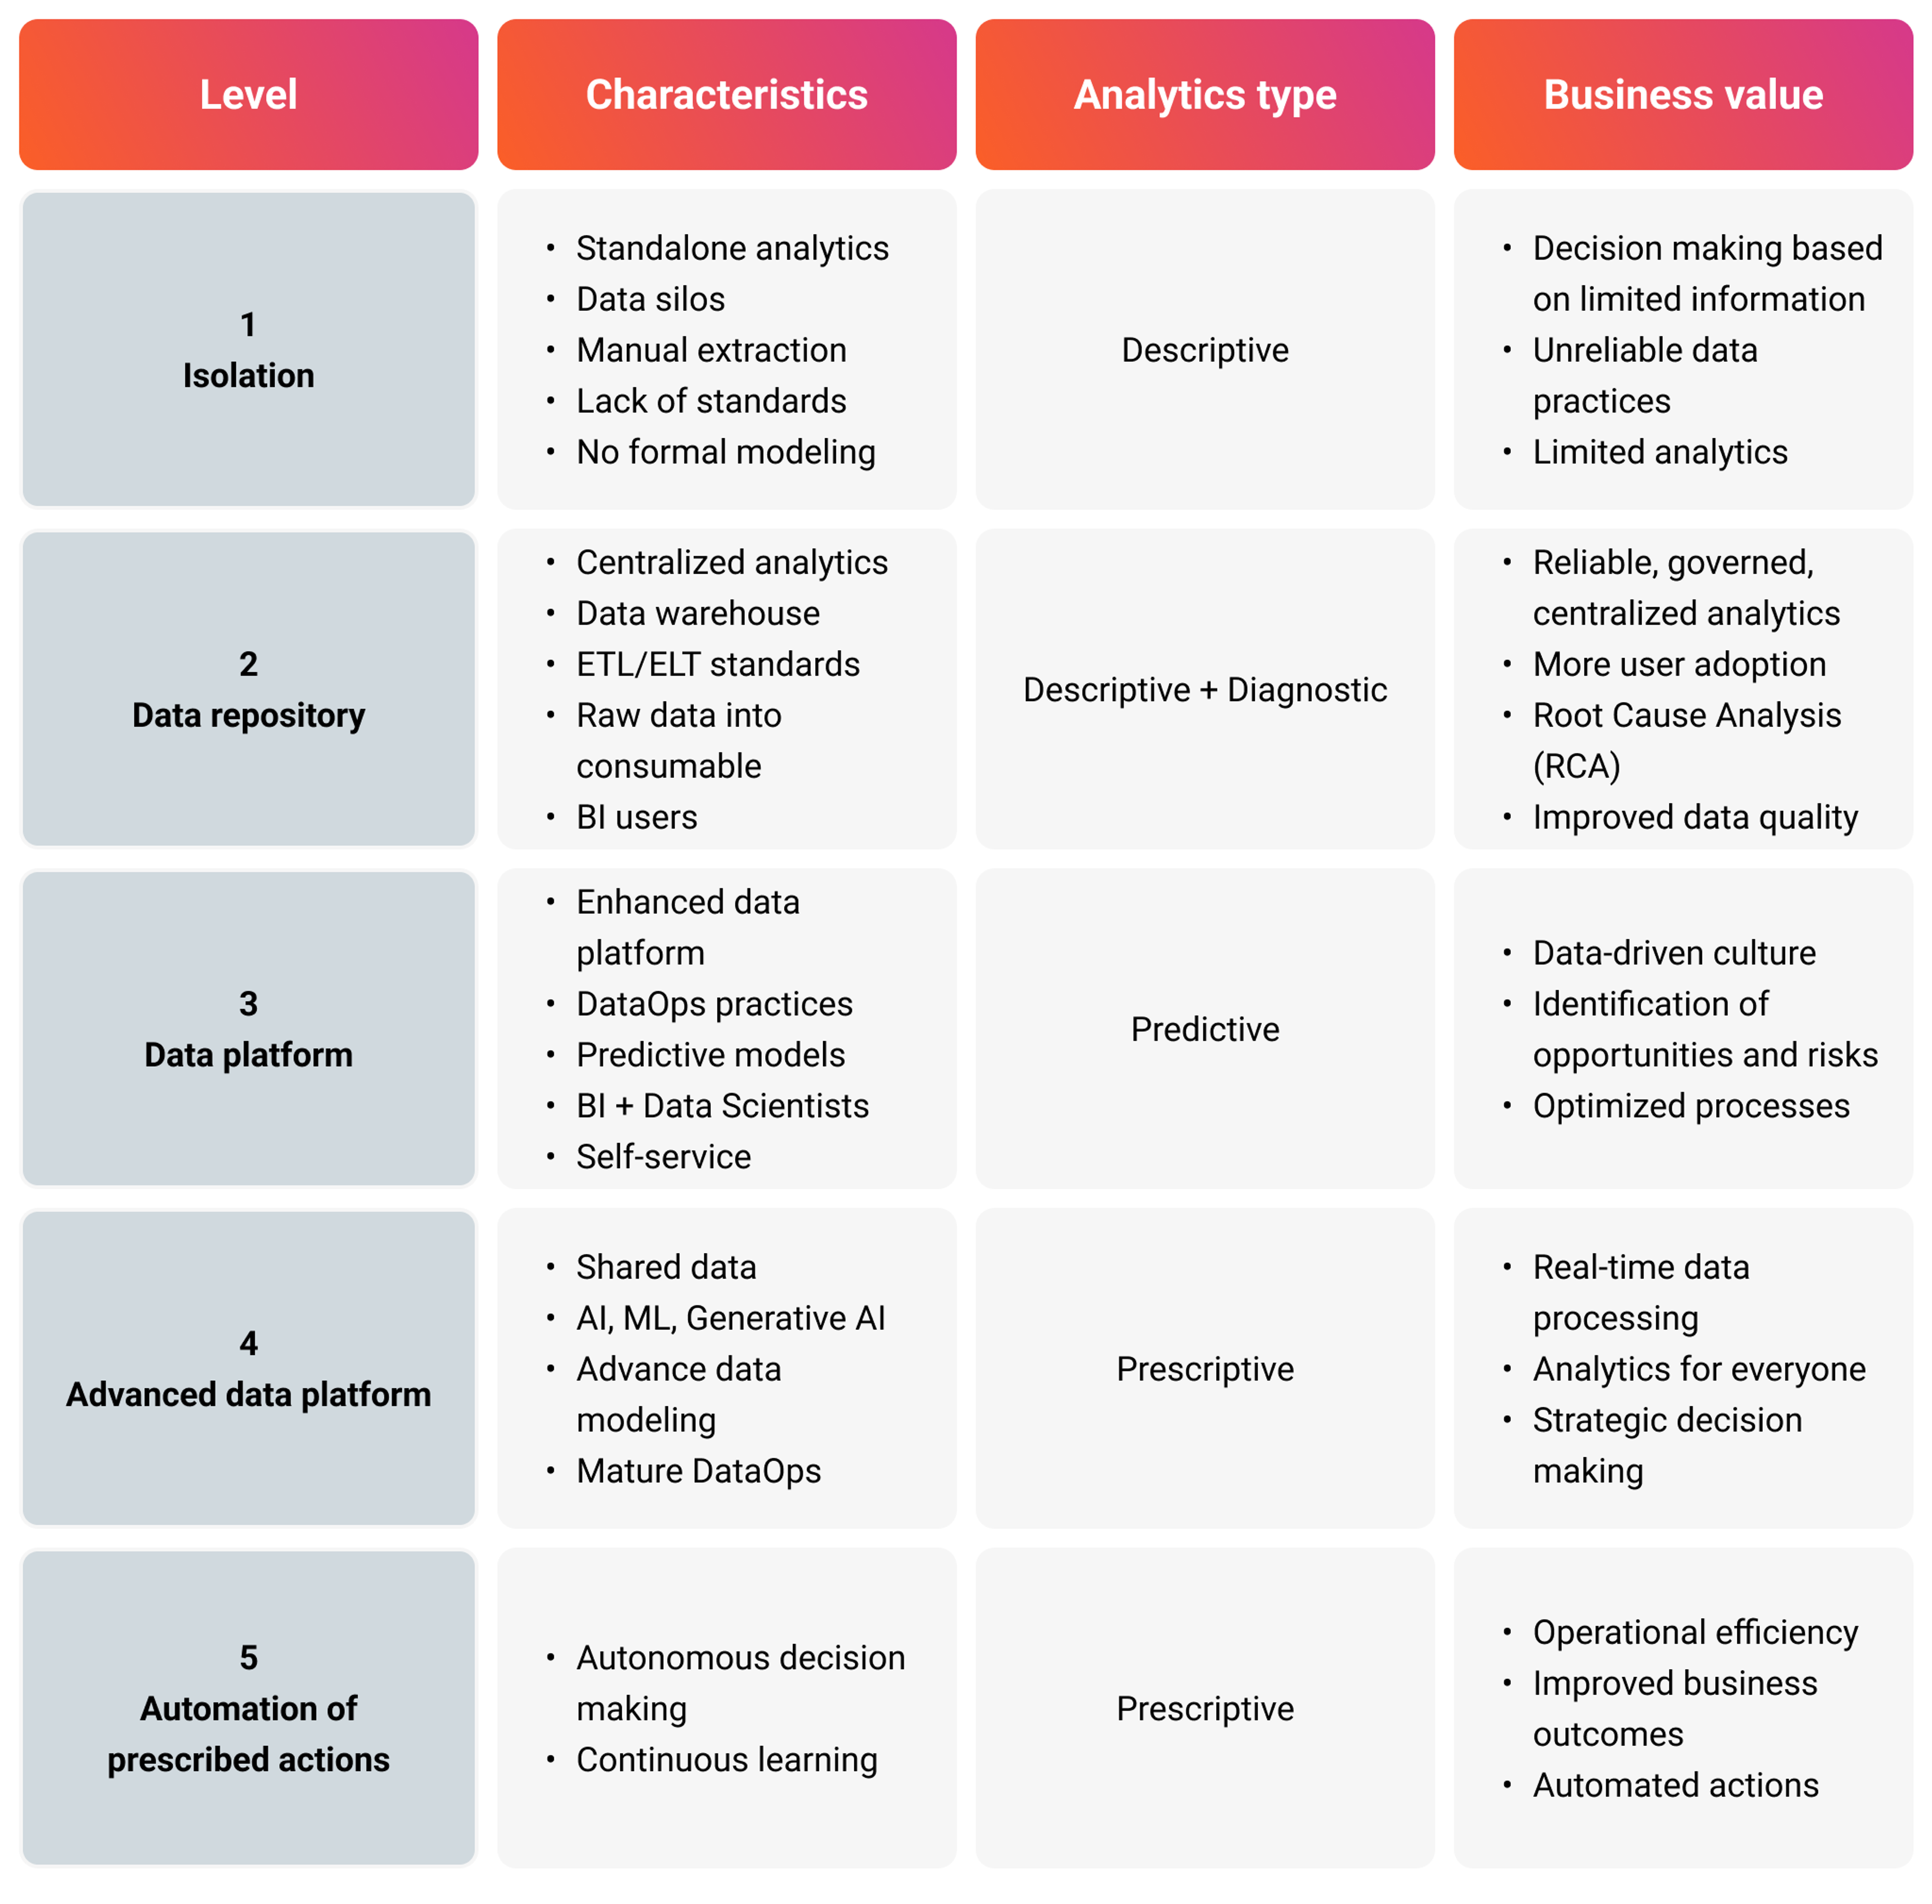
The Data & Analytics Maturity Curve is a powerful framework that helps organizations assess and enhance their data practices. To sum up, here is a table that summarizes the main characteristics and business value of each level.

By understanding where your organization stands on this curve, you can identify areas for improvement and take strategic actions to advance your business’ data capabilities. From isolated data practices to the automation of prescribed actions, each level represents a significant step towards becoming a data-driven organization. This is crucial for companies to ensure that their data management processes are efficient, scalable, and aligned with industry standards. Achieving data maturity not only optimizes costs and mitigates risks but also supports scalability and innovation, allowing businesses to grow and adapt their data infrastructure as needed.

Service
Enhance decision-making with data-driven solutions and advanced analytics. Our comprehensive service covers the entire data lifecycle.

Success Case
Precision AQ, a provider of Market Access data for Pharma & Healthcare, partnered with CloudX to build a platform for operational delivery processes with an…

Insights
We have been talking about Artificial Intelligence for at least half a century. So, what is the hype? How is the new AI different from traditional AI? In this…